3.2 Overview Report
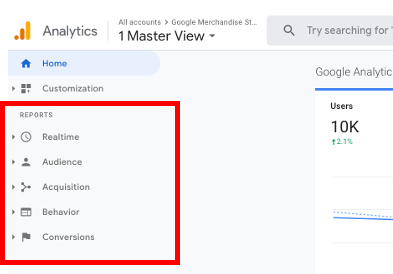
Now that you've logged on, you'll see a menu on the left of the page, which includes five reporting areas: RealTime, Audience, Acquisition, Behavior, and Conversion. Each of these areas includes an Overview report.

To view the Audience Overview report:
- From the menu on the left, click Audience followed by Overview.
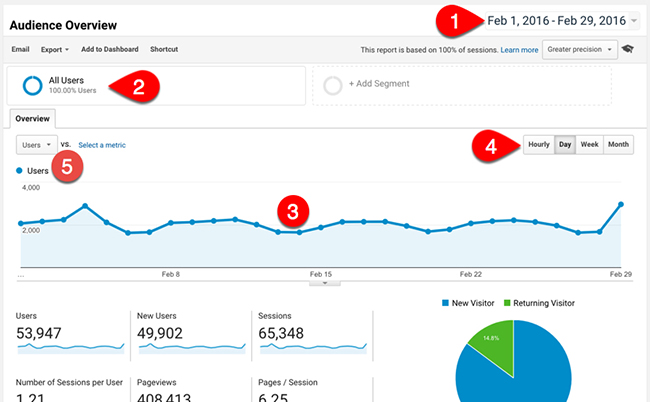
The Audience Overview report is a summary of the metrics that appear in the Audience reports. It shows aggregated Audience metrics like number of users, pages they visited in a session, and average session duration.

The above numbers with a red background relate to aspects that are common to many reports.
They are described below, and you can investigate each area yourself through Google Analytics...
1. Date Range Selector
The date-range selector appears at the top of every report. If you click it, a calendar opens so that you can select date ranges for reports. When you select a new date range and click Apply, it affects all the reports in your view.
To compare two date ranges, click the calendar's 'Compare to' checkbox and define another date range.
2. Segment Picker
Also at the top of every report is the Segment Picker, which shows the segments currently applied to the report. The default segment includes everyone who's visited your site. You can, however, add new segments for comparison.
3. Line Graph
Below the segment picker are different metrics in different formats. The most obvious is a line graph which shows the number of users on each day in the selected date range.
4. Time Selector
If you want to change the 'granularity' of this data, you can select to see it either hourly, weekly or monthly.
5. Metric Selector
You can change the metric in the graph, and also compare metrics by clicking 'Select a metric' from the drop-down metric selector.
Next